NEXT ROBOTTECHDATA CENTER EPC
01 — 02Site selection & feasibility

Two questions decide the project

Before a line is drawn we settle the two questions that decide whether the project exists at all: can this site get the power, and does the business case survive the grid offer.

01Site selection

Power first. Land second.

A perfect plot with no grid capacity is not a data center site. We screen candidates against twelve hard constraints before anyone signs for land.
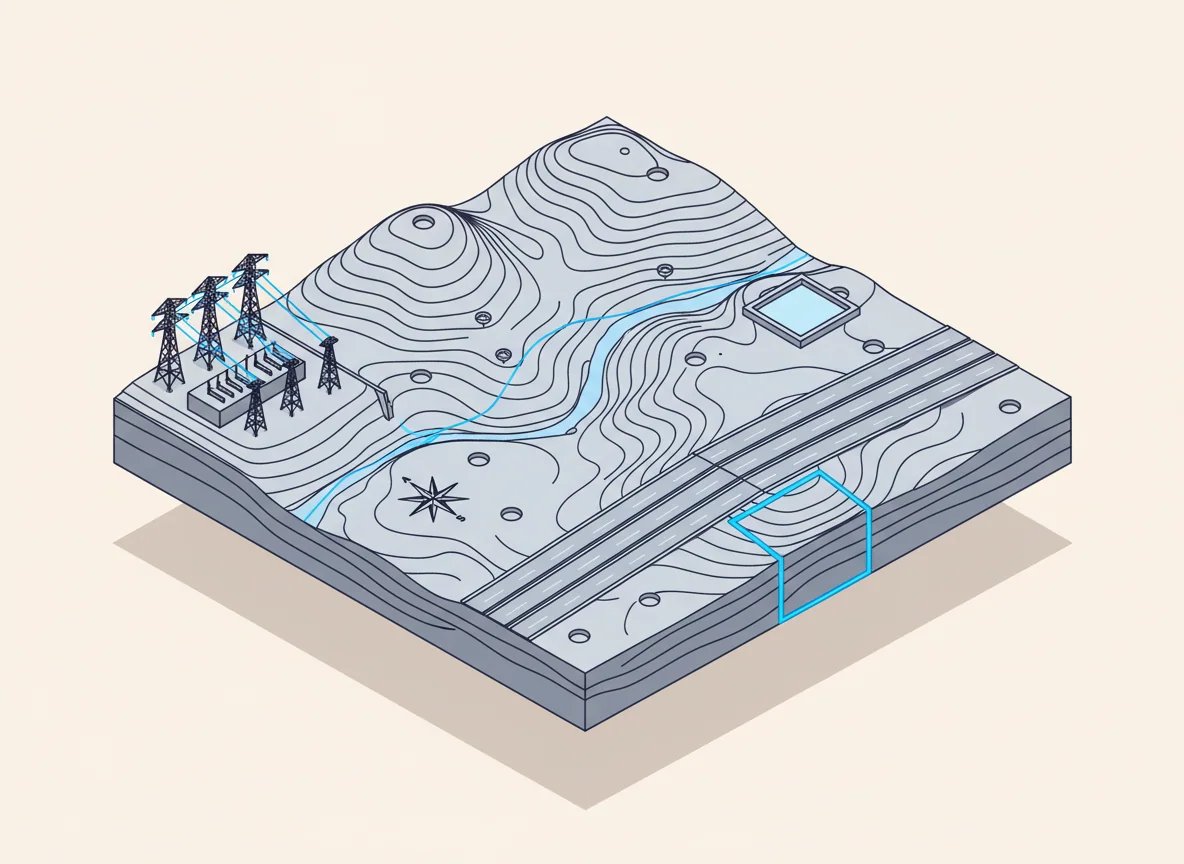
Site analysis block model
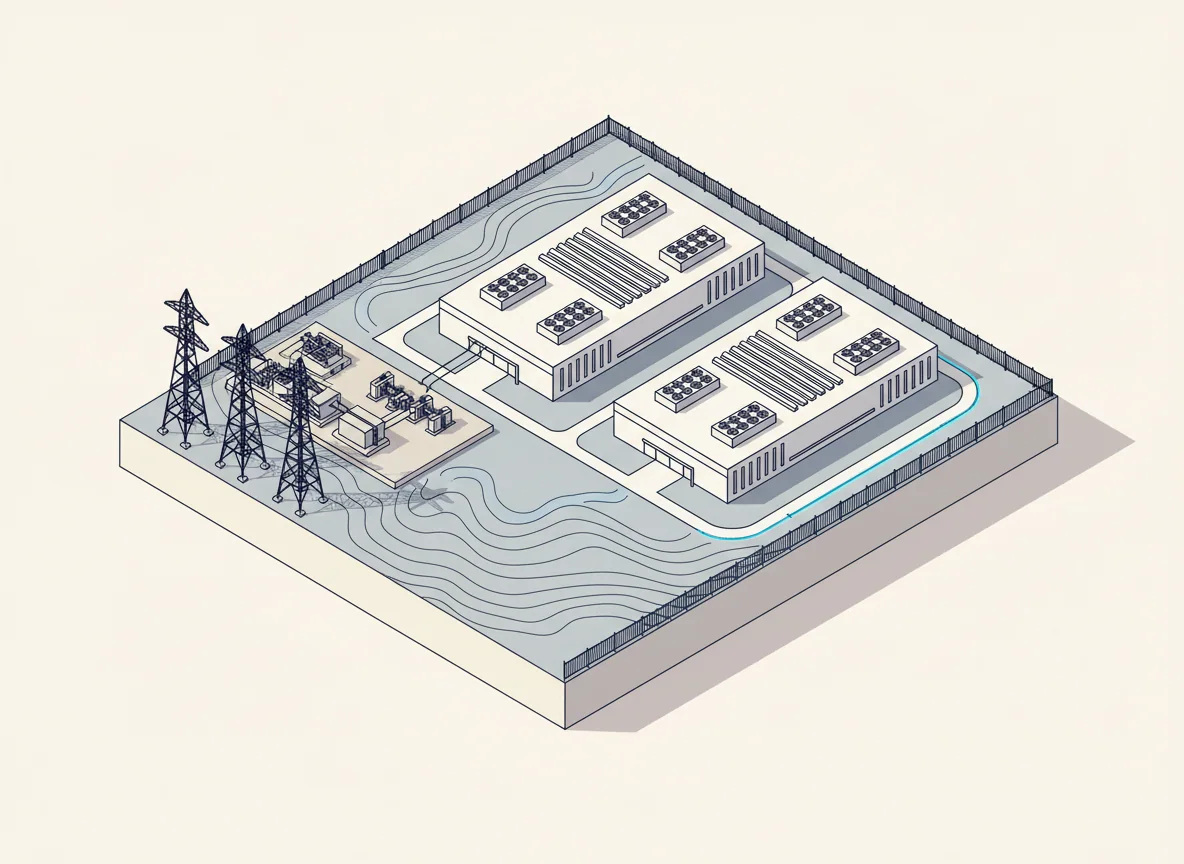
Planned facility on the site
Site scan active
Terrain block model: grid connection, fibre trunk, hydrology, geology and the constrained building envelope.
01Available grid capacity
02Cost of electricity
03Substation proximity
04Fibre routes & carriers
05Distance from population
06Heavy-lift logistics
07Temperature & humidity
08Flood & hydrology risk
09Geology & bearing capacity
10Water availability
11Land control & zoning
12Backup generation siting
Preliminary region assessment
AI-grade site score
0/100
Relative to screened regions
Tariff$0.048/kWh
PUE delta-0.07
Build cost index1.12×
SeismicNegligible
Grid capacity

Hydro-fed, high headroom

Fibre & carriers

Good, 2–3 carriers

Climate

Cold — free cooling year round

Water

Abundant

Indicative screening only. Actual capacity, tariff and connection date are confirmed with the network operator during feasibility.

02Feasibility study

The business case, live

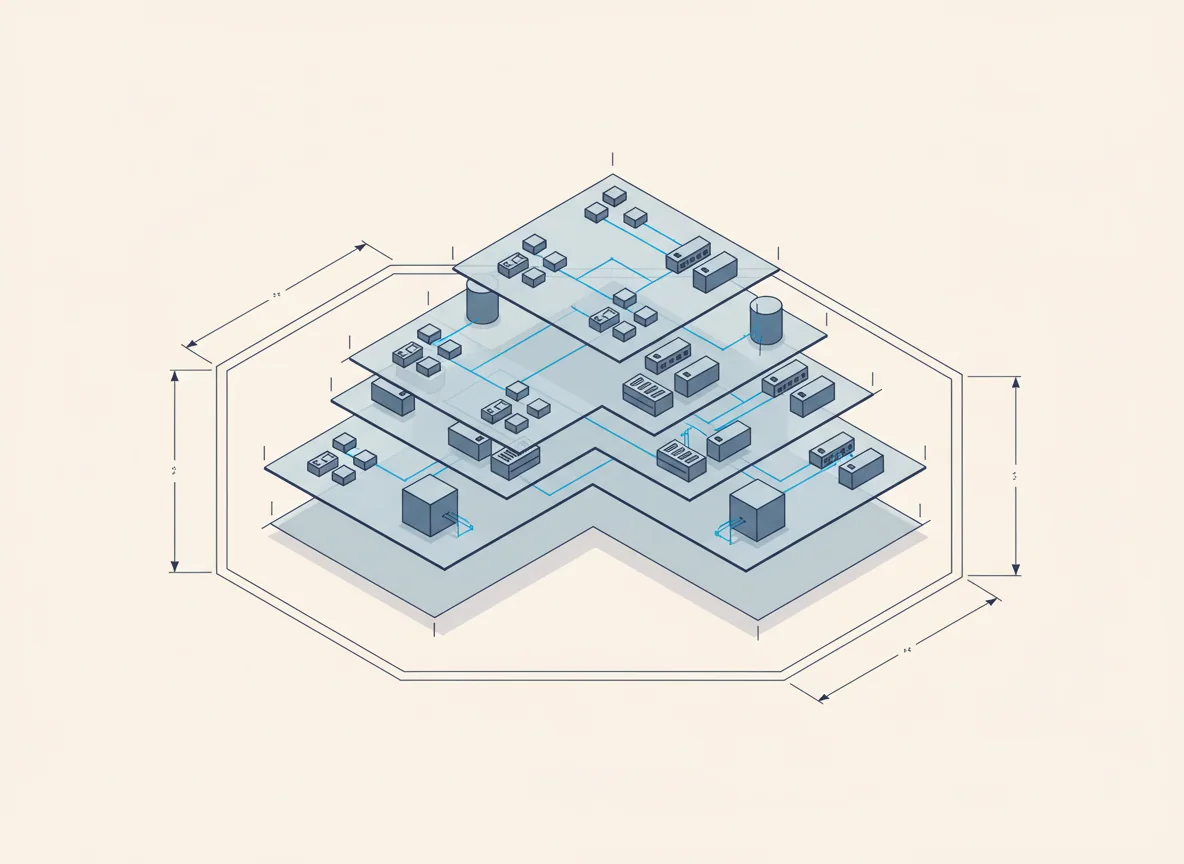
Move the inputs and watch the facility change. This is the same structure as the model we build for lenders — only simplified.

Inputs
Cooling
Region

Tier III, N+1 assumed at this stage. Full topology options are on the estimator below.
Racks
333
PUE
1.17
Facility load
23.4 MW
Grid connection
27 MW
Estimated CAPEX
$212M
$10.6M / MW
Estimated OPEX
$24.9M/yr
151,688 MWh
White space
1,399 m²
3,694 m² gross
Programme
22 months
6 ha plot
CAPEX composition$212M
Power$82.8M
Cooling$47.0M
Building$13.6M
IT fit-out$19.5M
Network & security$6.0M
Grid connection$12.8M
Design & PM$16.7M
Contingency$13.9M
Capacity study model
What you receive
  • Capacity and PUE model
  • CAPEX / OPEX / TCO over 15 years
  • Topology options with cost deltas
  • Programme, phasing and risk register
Programme

From first meeting to first workload

A 20 MW greenfield facility, typical sequence. Phasing can compress this significantly — the first capacity block can go live while the next is still being built.

M 0SiteScreening, grid offer, land control
M 1–3FeasibilityCapacity model, CAPEX, programme
M 3–6DesignConcept and detailed engineering
M 6–9Permits & procurementApprovals, long-lead orders
M 9–18ConstructionEarthworks, structure, envelope
M 15–20InstallationMEP installation and cabling
M 19–22CommissioningL1–L5 testing, IST, load banks
M 22+Go-liveCertification, handover, operations
Fastest realistic programme
14–16 mo

Modular, existing grid connection, permitted site

Typical greenfield
20–24 mo

Own substation, Tier III, liquid cooled

Large AI campus, phased
28–36 mo

First block live at month 18

Next step

Tell us what you are building

Send the site status, the grid offer and the target load. You get a concept, a power and cooling strategy and an indicative CAPEX back.

Start a project